HAIviz: Visualizing Genomic Epidemiology Data of Healthcare Associated Infections
Poster Presentation: Budi Permana, Brian M. Forde, Leah W. Roberts, Patrick Harris, Scott A. Beatson.
Presented at ASM Conference on Rapid Applied Microbial Next Generation Sequencing and Bioinformatic Pipelines, Washington, D.C., USA, 2018
Abstract
Introduction: Interactive visualization is not only essential for communicating information but also able to function as an exploratory instrument. Over the past few years, several visualization tools have been developed and utilized this feature for epidemiological studies[1-3]. However, these tools mainly focused on global epidemiology and phylogeography, while tools particular to local outbreaks, such as healthcare-associated infection (HAI), are still lacking.
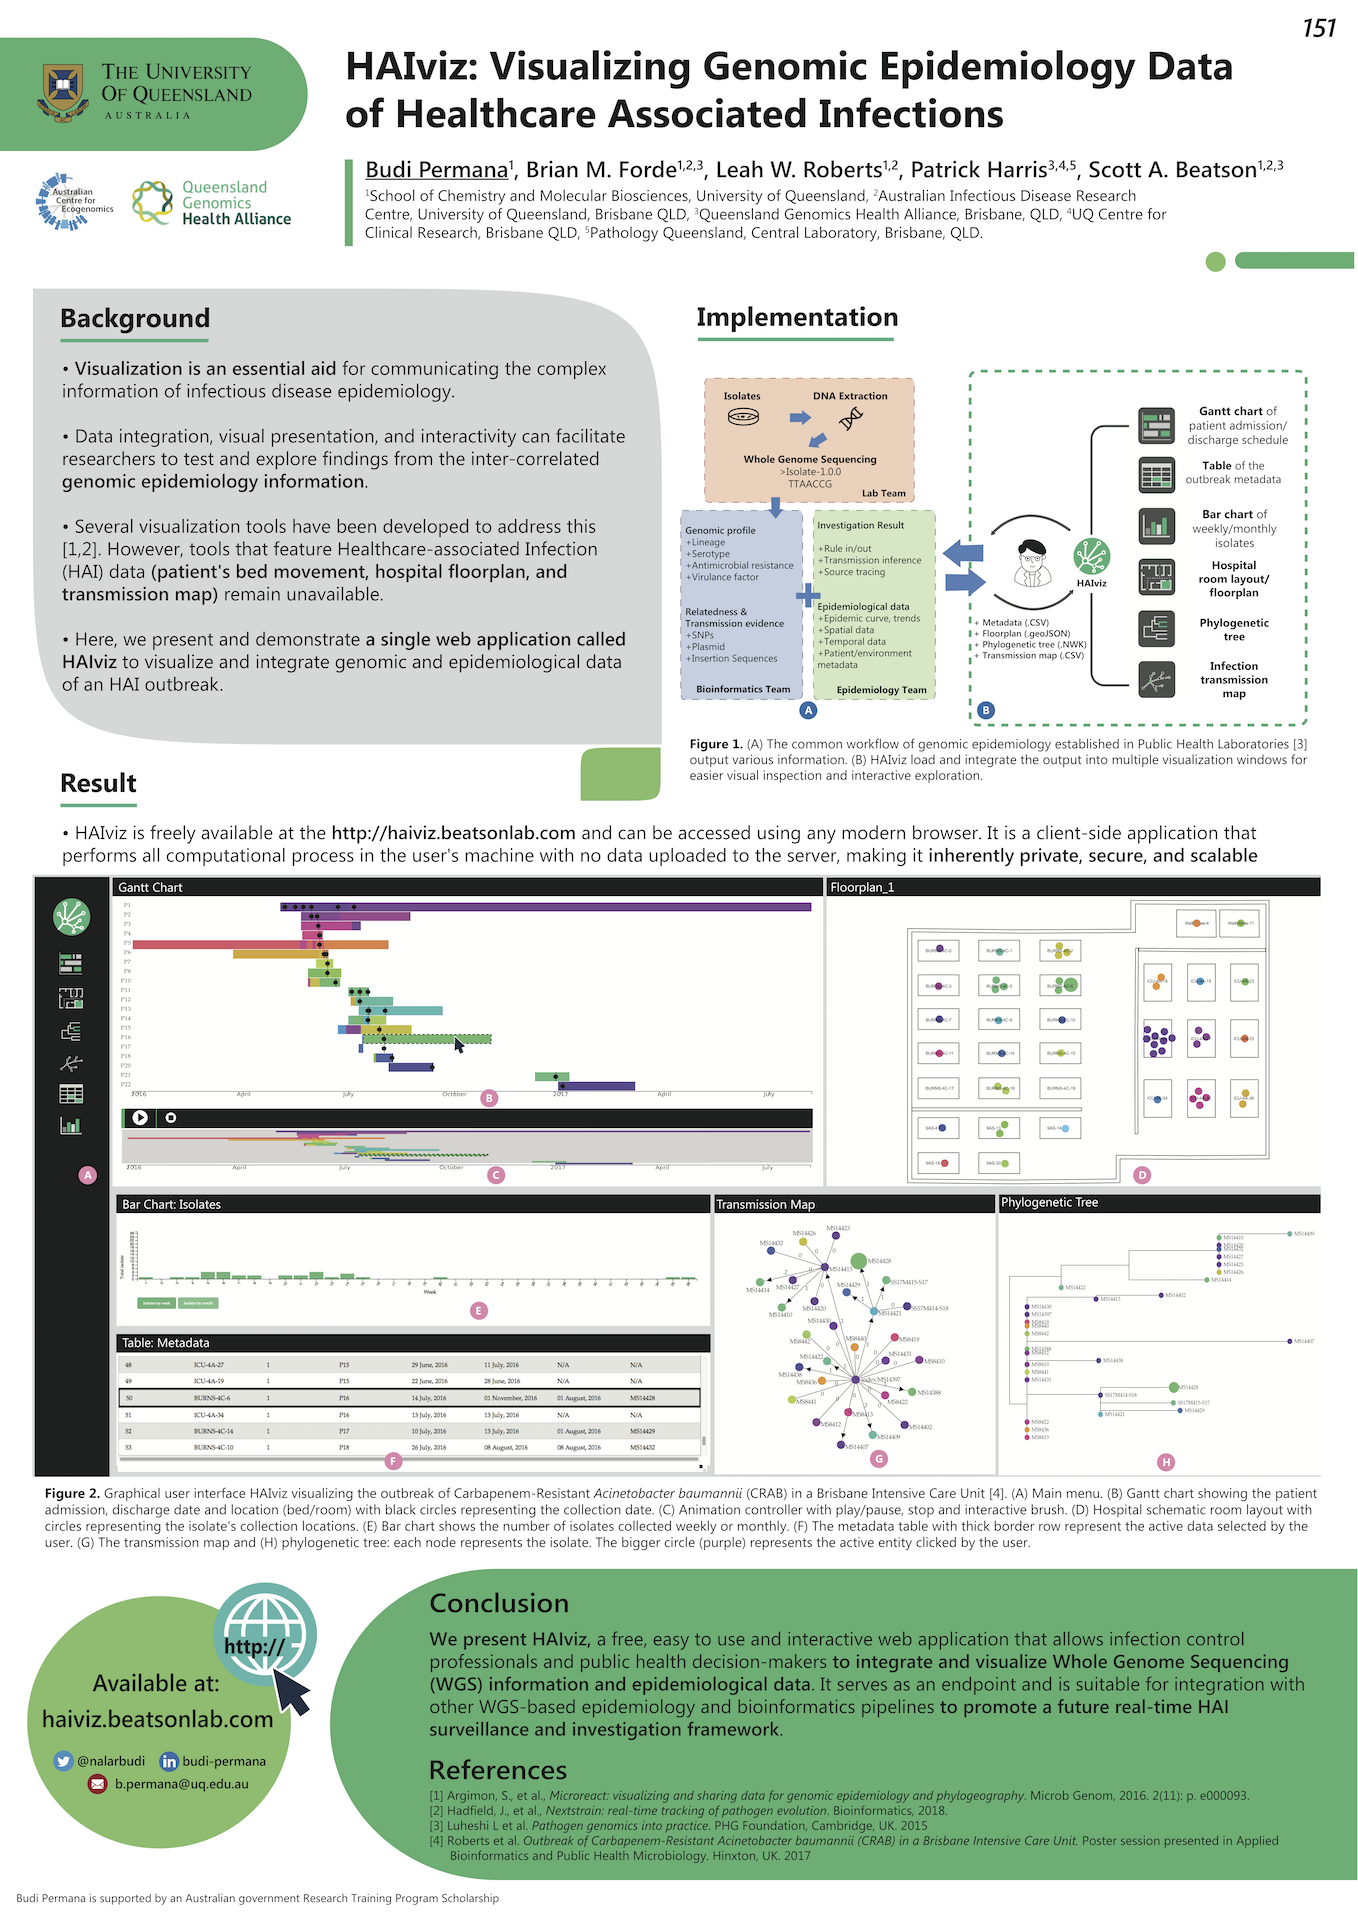
Methods: We developed HAIviz, a web-based single page interactive visualization application to help infection control professionals visualize, integrate and explore data related to the implementation of genomic epidemiology during the HAI outbreak investigations, using HTML and JavaScript.
Results: HAIviz is now serving in-browser visualization service for displaying patient admission schedules, interior hospital maps, isolate phylogenetic tree, and patient transmission network. Users can create multi visualization windows by loading their dataset into the browser and interactively explore the images or save it for publication. HAIviz performs all computational process in the user’s machine with no information posted to the server, therefore it inherently private, secure, and scalable. At this stage, HAIviz is accessible as a standalone visualization application that works with the input files created by a separate workflow. In the future, HAIviz aimed to be an integrated system with WGS-based pipeline, promoting the application of genomic epidemiology in HAI outbreak surveillance and investigation.
Conclusion: HAIviz is freely available at the http://haiviz.fordelab.com. Users can access the website using any modern browser to create explorative visualization or to try the features using the included mock dataset.
Poster: